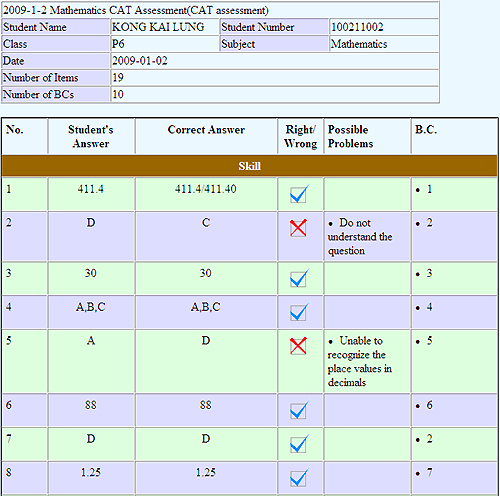
When a student completes a computer adaptive test, he will
receive basic information on the number of correct and incorrect
responses. For those items with incorrect responses, further
analysis will be provided for reference. From the information
provided, the student could learn from the errors committed.
To facilitate the monitoring of student performance in a subject,
a number of additional reports are provided to teachers and
principals. The reports could be classified into three levels:
(i) student-level; (ii) class-level) and (iii) year-level
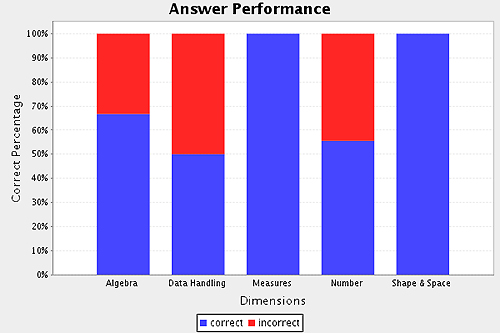
Student -level:
For each test session completed by a student, the percentage
of correctness/ incorrectness by subject dimension is available
in the form of a stacked bar.
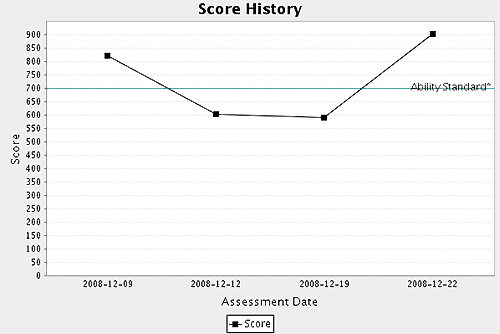
For a number of test sessions completed by the same student
over a period, the profile of testing results at different
times is provided in the form of a line graph or a table of
data. When viewing the line graph, a teacher could assess
the “selected” session result of the student by clicking a
point in the line graph.
From the facilities and information provided, a teacher could
have a better understanding of a student’s ability in a subject
at a particular time and also the development trend of the
student over a period.
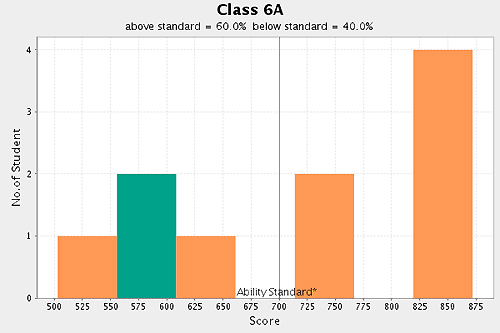
Class-level:
With respect to a test session created for a class of students,
the distribution of student results are provided in the form
of a histogram or a table of data. By clicking a part of histogram,
the teacher could assess a “selected” individual students’
detailed performance on that session.
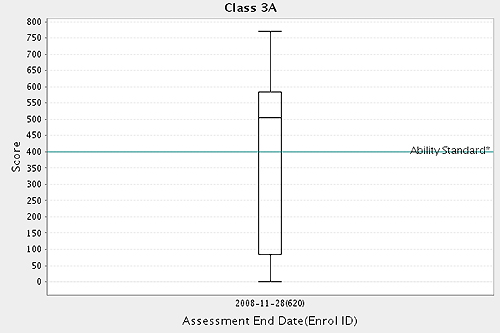
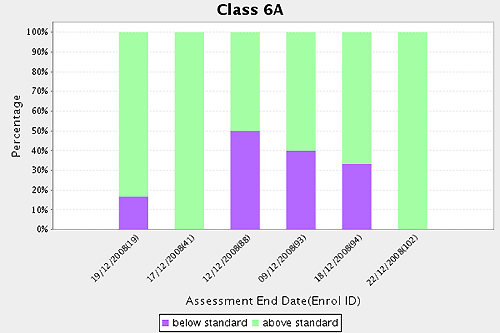
When more than one test session is completed by the same class
of students, the teacher could view the profile of these results
in the form of a number of boxplots or stacked bars (showing
the percentage above/below standard). Data in the form of
a table is also available. By clicking a specific boxplot/stacked
bar for a test session, the distribution of student results
for that session could be assessed.
From the facilities and information provided, a teacher could
easily grasp the overall performance of a class in a subject
at a particular time and also the development trend of the
class over a period.
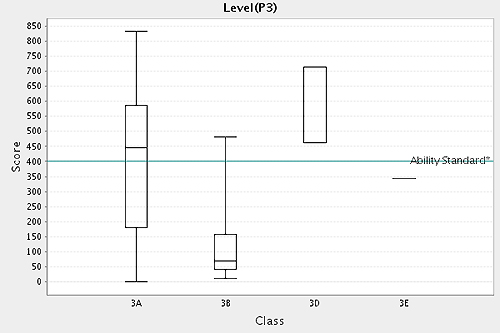
Year-level (across different classes):
A principal may like to compare the overall performance of
different classes in the same year level over a certain period.
Thus this kind of comparison is provided in the form of a
number of boxplots based on the latest available testing results
of each class over the period concerned. If the principal
would like to further examine a specific class, he could click
the boxplot for the class. The profile of testing results
for that class will then be displayed.
From the facilities and information provided, the differences
in performance over a number of classes in the same year level
could be gauged in a handy manner.